Kei Minagawa's Blog

皆川圭(@keimina)のブログ、Pythonで試したことを書いていきます

ニューラルネットワークで"Z = x*x + y*y"を学習させてみた

いきなりですが、関数 "Z=x*x + y*y" の様な曲面をニューラルネットワークで学習させてみます。ディープラーニングの話です。

目的:多層ニューラルネットワークが色々な関数を近似できるとは聞いていたが、それが本当かどうか確かめる。多層ニューラルネットワークを学習させた関数のグラフが関数"Z=x*x + y*y"と同様な曲面になるか確かめる。

注意:細かい話ですが、実際の関数は"Z=k(x*x + y*y) + c"(kとcは定数)です。xとyの範囲は[-1,1]です。

・モデルの構築
ニューラルネットワークのモデルは以下の条件1、2を満たす様に構築しました。

(条件1)「3層以上であること(全て全結合層)」
(条件2)「1層のニューロンの数が2以上であること」

(条件1の理由):3層以上でないと関数の非線形性を表現しきれないから
(条件2の理由):独立変数x,yを一つの変数で現すことは不可能、よって1層のニューロンの数は入力の独立変数の数より多くなければならないから

f:id:keimina:20180324025738p:plain

構築したネットワークを連立方程式で書くと以下の様になります。
今回は活性化関数としてtanh(ハイパボリックタンジェント)を用いることとしました。

# layer 1
x11 = tanh(a*x + b*y + c)
x21 = tanh(d*x + e*y + f)

# layer 2
x13 = tanh(g*x11 + h*x21 + i)
x23 = tanh(j*x11 + k*x21 + l)

# layer 3(output)
z= m*x13 + n*x23 + o

範囲「-1<x<1, -1<y<1」において、目的(Z=x*x + y*y)の関数と出力が同じになる様にパラメータを学習させます。パラメータの最適化には勾配下降法を用いています。

・実装
参考として、TensorFlow のコードを載せておきます。

import numpy as np
import tensorflow as tf
import random
from itertools import product
import time
from matplotlib import pyplot as plt
from mpl_toolkits.mplot3d import Axes3D
import math

def Mokuteki(x1, x2):
    return x1**2 + x2**2

k1 = math.sqrt(15)

I = tf.placeholder(tf.float32, (1, 2))
W1 = tf.Variable(k1*(1-2*tf.random_uniform((2, 2))))
B1 = tf.Variable(k1*(1-2*tf.random_uniform((1, 2))))

I2 = tf.nn.tanh(tf.matmul(I, W1) + B1)

W2 = tf.Variable(k1*(1-2*tf.random_uniform((2, 2))))
B2 = tf.Variable(k1*(1-2*tf.random_uniform((1, 2))))
I3 = tf.nn.tanh(tf.matmul(I2, W2) +  B2)

W3 = tf.Variable(k1*(1-2*tf.random_uniform((2, 1))))
B3 = tf.Variable(k1*(1-2*tf.random_uniform((1,))))
Y = tf.matmul(I3, W3) + B3

T = tf.placeholder(tf.float32)
L = tf.square(T - Y)
train_step = tf.train.GradientDescentOptimizer(0.03).minimize(L)

#training data
N = 16
x1_range = np.linspace(-1,1,N, dtype=np.float32)
x2_range = np.linspace(-1,1,N, dtype=np.float32)
train_x1, train_x2 = np.meshgrid(x1_range, x2_range)
train_y = np.array([Mokuteki(val1, val2) for val1, val2 in zip(train_x1.flatten(), train_x2.flatten())], dtype=float).reshape(N,N)
train_y -= np.mean(train_y)
train_y /= np.std(train_y)

init = tf.global_variables_initializer()

sess = tf.Session()
sess.run(init)

start_time = time.time()
for n_epoch in range(100):
    sample_all = random.sample(list(zip(train_x1.flatten(), train_x2.flatten(), train_y.flatten())), N*N)
    for x1v, x2v, tv in sample_all:
        sess.run(train_step, feed_dict={I:[[x1v,x2v]], T:tv})

    total_err = 0.0
    for x1v, x2v, tv in sample_all:
        total_err +=  sess.run(L, feed_dict={I:[[x1v, x2v]], T:tv})
    print("%d epoch:"%n_epoch, "loss:%f"%(total_err/N/N))

print("%d sec"%(time.time()-start_time))
print("finished")

fig = plt.figure()
ax = fig.add_subplot(111, projection='3d')
ax.plot_surface(train_x1, train_x2, np.array([sess.run(Y, feed_dict={I:[[x1v, x2v]]}) for x1v, x2v in zip(train_x1.flatten(), train_x2.flatten())], dtype=float).reshape(N,N))
plt.show()

sess.close()


やっていることは、まず、範囲「-1<x<1, -1<y<1」における Z = x*x + x*x の集合を訓練データとして生成し、あらかじめシャッフルしておく。ニューラルネットワークの出力を表す関数と、訓練データの2乗誤差をとる新たな関数Lを定義。勾配下降法により、その関数Lを最小にする様にパラメータを調整。
注意:表示される"loss:"は2乗誤差の値の平均値が記載されます。

最後に、6000エポックまでの学習中の関数のグラフの変化を動画にしました。
関数のグラフが、平衡状態から崩れて別の形になったりと興味深いです。

youtu.be

パラメータの初期値と学習係数を変えて色々と試してみましたが、ソースコードにあるもので落ち着いています。一番困ったのが、局所解で平衡状態になって抜け出せなくなってしまう場合です。局所解におちいらない様な設定値の作り方やアルゴリズムを知っていたら教えてください。

以上です。

numpy.sumのaxisを指定したときの挙動が覚えられないのでイメージ化してみた

numpyの関数にはnumpy.sumやnumpy.anyなど引数にaxisを指定できる場合があるのだけど、いまいちイメージがつかめなかったのでnp.sumのaxis指定したときの挙動のイメージをお絵描きしました。2次元の行列に限定した話です。以下の図のように「axis=0のときは踏みつぶす」、「axis=1のときは握り潰す」とイメージすることで解決です。あれ、踏み潰すのはどっちだっけ。それでは、おやすみなさい。


f:id:keimina:20180302222915j:image

エクセルのアルファベットの列番号を数値に変換するPythonプログラム

昼休みの暇つぶしに書いたコードを載せます。
エクセルのアルファベットの列番号を数値に変換する簡単なPythonプログラムになります。

例:
"A"は1
"Z"は26
"AA"は27

アルファベットを数値に変換し、各桁の重みをかけて右から左へ順に足しこんで行くプログラムです。
以下にアルファベットを数値に変換する関数conv(alphabet)とその関数のテストプログラムを示します。

inps = ['A', 'Z', 'AA', 'AZ', 'ZZ']
out_expects = [1, 26, 26+1, 26+26, 26*26+26]

def conv(alphabet):
	total = 0
	for n, i in enumerate(alphabet[::-1]):
		chr_num = ord(i.lower())
		chr_A_num = ord('a')
		total +=  (1 + chr_num - chr_A_num)* (26**n)
	return total
		
def test(inps, out_expects):
	for alphabet, out_expect in zip(inps, out_expects):
		out = conv(alphabet)
		print('input:%s, output:%s, out expect:%s'%(alphabet, str(out), str(out_expect)))
		print('%s' %('OK' if out==out_expect else 'NG'))
		
test(inps, out_expects)

テスト結果

input:A, output:1, out expect:1
OK
input:Z, output:26, out expect:26
OK
input:AA, output:27, out expect:27
OK
input:AZ, output:52, out expect:52
OK
input:ZZ, output:702, out expect:702
OK

昆布関数conv(alphabet)がアルファベットを数値に変換します。
出力結果の期待値については以下のように考えるとわかりやすいと思います。

'A'は1
'AA'は26+1
'AZ'は26+26
'BA'は26*2 + 1
'BZ'は26*2 + 26
、、、
'ZZ'は26*26+26

もちろん「conv(alphabet) - 1」とすれば0から始まるインデックスとして使うこともできます。
2進数変換はよく聞くけどこの形の変換は聞いたことがないです。
この形式の数はなんというのでしょうかね?16進数のように数値とアルファベットが混ざっているわけではないのでN進数という言葉ではない気がします。知っている人が入ればコメントください。


以上

2つの線の交点を表す数式を作ってpython matplotlibで検証

XY座標に点A1(Xa1, Ya1), A2(Xa2, Ya2), B1(Xb1, Yb1), B2(Xb2, Yb2)があったとして、

線A1A2 と 線B1B2の交点を数学的に求め、数式があってるか確かめようという話。

以下のように数学的に求めます。

  • まず交点の式をだします。

f:id:keimina:20171014081940j:plain

  • 次に上画像の一番下に書いてある方程式を解きます。

f:id:keimina:20171014081906j:plain

  • 逆行列をどうやって求めるかは、numpyライブラリを使わずに数学公式を使います。

行列Mとその逆行列invMの関係は以下になります。

M = ((a,b),(c,d))
invM = 1/(a*d - b*c) * ((d, -b),(-c, a))

参考:
2x2行列と3x3行列と4x4行列の逆行列の公式

  • 準備が整ったのでpythonで実装します。

交点を求める自作関数get_line_intersectionで上記で求めた数式を使っています。

from numpy import sin, cos, pi
import matplotlib.pyplot as plt
from matplotlib.widgets import Slider


class point:
    def __init__(self, x, y):
        self.x = float(x)
        self.y = float(y)

def get_line_intersection(A1, A2, B1, B2):
    a = A2.y - A1.y
    b = -B2.y + B1.y
    c = A2.x - A1.x
    d = -B2.x + B1.x
    C1 = B1.y - A1.y
    C2 = B1.x - A1.x
    
    tmp = a * d - b * c
    if tmp:
        invMa = d  / tmp
        invMb = -b / tmp
        invMc = -c / tmp
        invMd = a  / tmp
        
        m = invMa * C1 + invMb * C2
        n = invMc * C1 + invMd * C2

        if 0<=m<=1 and 0<=n<=1:#両方の線上に点がある場合は交点の座標を返す
            return point(A1.x + m * (A2.x - A1.x), A1.y + m * (A2.y - A1.y))
        else:
            return point(0, 0)#辺の延長線上に交点がある場合は(0,0)を返すこととする
    else:
        return point(0, 0)#逆行列が存在しない時は強制的に(0,0)を返すことにする

################################################################
# 描画
################################################################
fig, ax = plt.subplots()
ax.set_xlim(-11,29)
ax.set_ylim(-11,29)
ax.set_aspect('equal')

plt.subplots_adjust(left=0.25, bottom=0.35)
l1, = plt.plot([6, 6], [6 + 5 * cos(pi/2), 6 + 5 * sin(pi/2)])
l2, = plt.plot([12, 12], [12 + 5 * cos(pi/2), 12 + 5 * sin(pi/2)])
l3, = plt.plot([0],[0], marker="o")


axcolor = 'lightgoldenrodyellow'
axRA = plt.axes([0.25, 0.1, 0.65, 0.03], facecolor=axcolor)
axTA = plt.axes([0.25, 0.15, 0.65, 0.03], facecolor=axcolor)

axRB = plt.axes([0.25, 0.2, 0.65, 0.03], facecolor=axcolor)
axTB = plt.axes([0.25, 0.25, 0.65, 0.03], facecolor=axcolor)


RA = Slider(axRA, 'RadiusA', 0.0, 20.0, valinit=5.0)
TA = Slider(axTA, 'ThetaA', 0.0, 4 * pi, valinit=pi/2)

RB = Slider(axRB, 'RadiusB', 0.0, 20.0, valinit=5.0)
TB = Slider(axTB, 'ThetaB', 0.0, 4 * pi, valinit=pi/2)

def update(val):
    l1.set_xdata([6, 6 + RA.val * cos(TA.val)])
    l1.set_ydata([6, 6 + RA.val * sin(TA.val)])
    l2.set_xdata([12, 12 + RB.val * cos(TB.val)])
    l2.set_ydata([12, 12 + RB.val * sin(TB.val)])
    p = get_line_intersection(point(6,6), point(6+RA.val*cos(TA.val), 6+RA.val*sin(TA.val)), point(12,12), point(12+RB.val*cos(TB.val), 12+RB.val*sin(TB.val)))
    l3.set_xdata([p.x])
    l3.set_ydata([p.y])
    fig.canvas.draw_idle()

RA.on_changed(update)
TA.on_changed(update)
RB.on_changed(update)
TB.on_changed(update)

plt.show()
  • 実行結果

youtu.be

  • 計算時間

CPU Core i7 2.0Ghzで計算したが計算時間は100万回やっても5秒くらいらしい

100000 loops, best of 3: 4.76 µs per loop

無人島で直角三角形の角度をかなりアバウト(誤差20%以内)に計りたい時に使えるかもしれない簡単な計算式

おそらく、無人島の先生がこの直角三角形のアバウトな角度出しなさいという問題に答える生徒しか使わない気がしますが一応書いておきます。

無人島で直角三角形ABCの角度をアバウトに図りたい時は

角度 = 60 * 高さ / 底辺

を計算します。計算した角度から大まかな誤差を求めます。

誤差は
40°で約20%
20°で約10%
10°で約5%
となります。

この誤差をみて使えるか使えないか判断するとよいでしょう。
誤差が大きい場合は別の手法を使いましょう。

この数式の背景にあるもの:

x が 0 に限りなく近い時以下が成り立ちます。
x = tan(x)

私の疑問として、

  • x が 0 に近くないときも使ってみたとしたら誤差がどれくらいになるのか、
  • 計算を簡単にするため円周率を3.14ではなく3にしてみたらどれくらいになるのか

というのがあり、それを計算機で計算し誤差を求めた結果、上記数式が使えない使えることを発見しました。

検証は以下のコードでで行いました。

import numpy as np
import matplotlib.pyplot as plt

def rad_to_degree(rad):
    return rad * 60

end_degree = 45
xdegree = np.linspace(0.000000000000001,end_degree,100)
xrad = np.pi * 2 * xdegree / 360
guess_degree = rad_to_degree(np.tan(xrad))
true_degree = xdegree
diff = guess_degree - true_degree

fig = plt.figure()

ax = fig.add_subplot(111)
ax.set_xlabel("x [Degree]", fontsize=14, fontweight='bold')
ax.set_ylabel("gosa [%]", fontsize=14, fontweight='bold')
ax.plot(xdegree, abs(diff)/true_degree*100)

plt.show()

f:id:keimina:20171007162529p:plain

以上です。

二値画像にk-meansを適用し、細線化?してみる

前回の続きです。今度は二値画像にk-meansを適用し、細線化?してみます。
二値画像においてk-meansが細線化や情報削減に利用できるのではないかと思えるような結果になりました。今回は、scipyのkmeans2を使用し、代表点の初期配置を領域内に収めることで、細線化?を実現します。

ソース:
(関係のないモジュールをimportしまくってますが無視してください。)

# -*- coding: utf-8 -*-
from itertools import combinations
from itertools import product
import random
import re
import numpy as np
from numpy import arange
import matplotlib.pyplot as plt
from scipy.ndimage import zoom
from scipy.fftpack import fft, ifft
from scipy.signal import resample
from scipy.spatial import Delaunay
import matplotlib.tri as tri
from scipy.cluster.vq import kmeans,vq
from scipy.cluster.vq import kmeans2,vq

def rawObjectToMatrix(ro):
    ret = []
    lines = ro.splitlines()
    for line in lines:
        if line.strip()=="":
            continue
        ret.append(map(lambda x: 0 if x == " " else 1, line))
    whiteRow = [[0 for _ in xrange(len(ret[0]))]]
    return whiteRow + ret + whiteRow

def pb(lst2d):
    ret = ""
    for lst in lst2d:
        lst = map(abs, lst)
        ret += "".join(map(str, lst)) + "\n"
    print ""
    print ret

def readMyData():
    with open("a.txt", 'r') as fp:
        text = fp.read()
    objectRawDataList = re.split(r"\n\n", text)
    objectRawDataList = filter(lambda x: x != "", objectRawDataList)
    return map(lambda ro: rawObjectToMatrix(ro), objectRawDataList)

lst = readMyData()

sampleMatrix = zoom(np.array(lst[5]), 1.5)
pb(sampleMatrix)

height = sampleMatrix.shape[0]
width = sampleMatrix.shape[1]

mat = sampleMatrix.copy()
for rn, _ in enumerate(mat):
    for cn, __ in enumerate(_):
        if mat[rn, cn] == 1 and mat[rn + 1, cn] == 1:
            mat[rn, cn] = 0

out = mat
mat = sampleMatrix.copy()
for rn, _ in enumerate(mat):
    for cn, __ in enumerate(_):
        if mat[(height - 1) - rn, cn] == 1 and mat[(height - 1) - rn - 1, cn] == 1:
            mat[(height - 1) - rn, cn] = 0

out |= mat
mat = sampleMatrix.copy()
for rn, _ in enumerate(mat):
    for cn, __ in enumerate(_):
        if mat[rn, cn] == 1 and mat[rn, cn + 1] == 1:
            mat[rn, cn] = 0

out |= mat
mat = sampleMatrix.copy()
for rn, _ in enumerate(mat):
    for cn, __ in enumerate(_):
        if mat[rn, (width - 1) - cn] == 1 and mat[rn, (width - 1) - cn - 1] == 1:
            mat[rn, (width - 1) - cn] = 0

out |= mat  

firstPosFlat = out.flatten().argmax()
pos = firstPosFlat / width, firstPosFlat % width
startPos = pos
code = []
while True:
    if   out[pos[0] - 1, pos[1]    ] == 1:
        out[pos[0] - 1, pos[1]    ] = 2
        pos = pos[0] - 1, pos[1]
        code.append((-1, 0))
    elif out[pos[0] - 1, pos[1] + 1] == 1:
        out[pos[0] - 1, pos[1] + 1] = 2
        pos = pos[0] - 1, pos[1] + 1
        code.append((-1, 1))
    elif out[pos[0]    , pos[1] + 1] == 1:
        out[pos[0]    , pos[1] + 1] = 2
        pos = pos[0]    , pos[1] + 1
        code.append((0, 1))
    elif out[pos[0] + 1, pos[1] + 1] == 1:
        out[pos[0] + 1, pos[1] + 1] = 2
        pos = pos[0] + 1, pos[1] + 1
        code.append((1, 1))
    elif out[pos[0] + 1, pos[1]    ] == 1:
        out[pos[0] + 1, pos[1]    ] = 2
        pos = pos[0] + 1, pos[1]    
        code.append((1, 0))
    elif out[pos[0] + 1, pos[1] - 1] == 1:
        out[pos[0] + 1, pos[1] - 1] = 2
        pos = pos[0] + 1, pos[1] - 1
        code.append((1, -1))
    elif out[pos[0]    , pos[1] - 1] == 1:
        out[pos[0]    , pos[1] - 1] = 2
        pos = pos[0]    , pos[1] - 1
        code.append((0, -1))
    elif out[pos[0] - 1, pos[1] - 1] == 1:
        out[pos[0] - 1, pos[1] - 1] = 2
        pos = pos[0] - 1, pos[1] - 1
        code.append((-1, -1))
    if pos == startPos:
        break

pr = startPos[0]
pc = startPos[1]
prlst = []
pclst = []
p = []
for n, c in enumerate(code):
    dr, dc = c
    pr += dr
    pc += dc
    prlst.append(pr)
    pclst.append(pc)
    p.append((pr, pc))

prlst = np.array(prlst)
pclst = np.array(pclst)

fig, ax = plt.subplots(1)
ax.plot(pclst, prlst)

numOfCentroids = 10
k = np.array(random.sample(zip(*np.where(sampleMatrix == 1)), numOfCentroids), dtype=np.float)
observation = np.array(zip(*np.where(sampleMatrix==1)), dtype=np.float)

# computing K-Means with K = 2 (2 clusters)
centroids,_ = kmeans2(observation, k, minit="point")

# assign each sample to a cluster
idx,_ = vq(observation,centroids)

centroidsRow, centroidsCol = centroids.T
centroidsRow = map(lambda x: int(round(x)), centroidsRow)
centroidsCol = map(lambda x: int(round(x)), centroidsCol)

sampleMatrixDummy = sampleMatrix.copy()
sampleMatrixDummy[centroidsRow, centroidsCol] = 5
pb(sampleMatrixDummy)

ax.plot(centroids[:,1], centroids[:,0], "sm")
fig.savefig("/Users/kei/Desktop/saisenka.png")

出力結果:

f:id:keimina:20160609223935p:plain

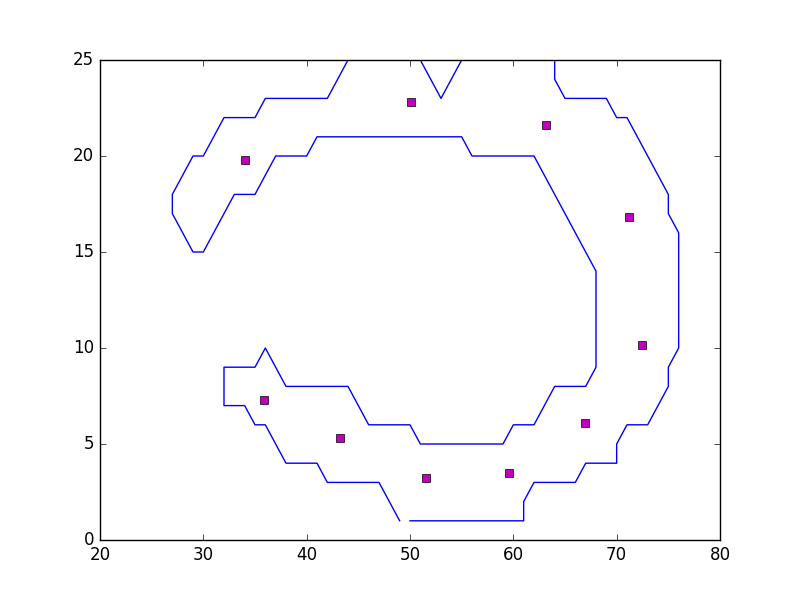
赤い点が周辺領域の代表点になります。形状の情報をよく表しているのではないかと思います。k-meansは形状の情報削減、圧縮、細線化などに使えそうなことがわかると思います。

抽出した輪郭を間引いてみる

昨日はオブジェクトから輪郭を抽出する処理を書きました。今日は、
輪郭を等間隔に間引いたものの形状がどうなるか見てみます。前処理としてオリジナルデータのオブジェクト領域が小さかったのでscipyのzoom関数で2倍に拡大してから処理に入っています。あと、符号化もしてます。等間隔に間引くだけなら符号化する必要はないかもしれませんが、あとで何かに使えるかもしれないので、符号化してみました。

# -*- coding: utf-8 -*-
import random
import re
import numpy as np
from numpy import arange
import matplotlib.pyplot as plt
from scipy.ndimage import zoom

def rawObjectToMatrix(ro):
    ret = []
    lines = ro.splitlines()
    for line in lines:
        if line.strip()=="":
            continue
        ret.append(map(lambda x: 0 if x == " " else 1, line))
    whiteRow = [[0 for _ in xrange(len(ret[0]))]]
    return whiteRow + ret + whiteRow

def pb(lst2d):
    ret = ""
    for lst in lst2d:
        lst = map(abs, lst)
        ret += "".join(map(str, lst)) + "\n"
    print ""
    print ret

def readMyData():
    with open("a.txt", 'r') as fp:
        text = fp.read()
    objectRawDataList = re.split(r"\n\n", text)
    objectRawDataList = filter(lambda x: x != "", objectRawDataList)
    return map(lambda ro: rawObjectToMatrix(ro), objectRawDataList)

lst = readMyData()

sampleMatrix = zoom(np.array(lst[5]), 1.5)
pb(sampleMatrix)

height = sampleMatrix.shape[0]
width = sampleMatrix.shape[1]

mat = sampleMatrix.copy()
for rn, _ in enumerate(mat):
    for cn, __ in enumerate(_):
        if mat[rn, cn] == 1 and mat[rn + 1, cn] == 1:
            mat[rn, cn] = 0

out = mat
mat = sampleMatrix.copy()
for rn, _ in enumerate(mat):
    for cn, __ in enumerate(_):
        if mat[(height - 1) - rn, cn] == 1 and mat[(height - 1) - rn - 1, cn] == 1:
            mat[(height - 1) - rn, cn] = 0

out |= mat
mat = sampleMatrix.copy()
for rn, _ in enumerate(mat):
    for cn, __ in enumerate(_):
        if mat[rn, cn] == 1 and mat[rn, cn + 1] == 1:
            mat[rn, cn] = 0

out |= mat
mat = sampleMatrix.copy()
for rn, _ in enumerate(mat):
    for cn, __ in enumerate(_):
        if mat[rn, (width - 1) - cn] == 1 and mat[rn, (width - 1) - cn - 1] == 1:
            mat[rn, (width - 1) - cn] = 0

out |= mat  
pb(out)

firstPosFlat = out.flatten().argmax()
pos = firstPosFlat / width, firstPosFlat % width
startPos = pos
code = []
while True:
    if   out[pos[0] - 1, pos[1]    ] == 1:
        out[pos[0] - 1, pos[1]    ] = 2
        pos = pos[0] - 1, pos[1]
        code.append((-1, 0))
    elif out[pos[0] - 1, pos[1] + 1] == 1:
        out[pos[0] - 1, pos[1] + 1] = 2
        pos = pos[0] - 1, pos[1] + 1
        code.append((-1, 1))
    elif out[pos[0]    , pos[1] + 1] == 1:
        out[pos[0]    , pos[1] + 1] = 2
        pos = pos[0]    , pos[1] + 1
        code.append((0, 1))
    elif out[pos[0] + 1, pos[1] + 1] == 1:
        out[pos[0] + 1, pos[1] + 1] = 2
        pos = pos[0] + 1, pos[1] + 1
        code.append((1, 1))
    elif out[pos[0] + 1, pos[1]    ] == 1:
        out[pos[0] + 1, pos[1]    ] = 2
        pos = pos[0] + 1, pos[1]    
        code.append((1, 0))
    elif out[pos[0] + 1, pos[1] - 1] == 1:
        out[pos[0] + 1, pos[1] - 1] = 2
        pos = pos[0] + 1, pos[1] - 1
        code.append((1, -1))
    elif out[pos[0]    , pos[1] - 1] == 1:
        out[pos[0]    , pos[1] - 1] = 2
        pos = pos[0]    , pos[1] - 1
        code.append((0, -1))
    elif out[pos[0] - 1, pos[1] - 1] == 1:
        out[pos[0] - 1, pos[1] - 1] = 2
        pos = pos[0] - 1, pos[1] - 1
        code.append((-1, -1))
    if pos == startPos:
        break

pb(out)


mabiki = [1, 2, 4, 8, 16, 32]
for m in mabiki:
    pr = 0
    pc = 0
    p = []
    for n, c in enumerate(code):
        dr, dc = c
        pr += dr
        pc += dc
        if n % m == 0:
            p.append((pr, pc))

    x = map(lambda x: x[1], p)
    y = map(lambda x: x[0], p)
    x += [0]
    y += [0]
    fig, ax = plt.subplots(1)
    ax.plot(x, y)
    fig.savefig("/Users/kei/Desktop/mabiki%d.png"%m)

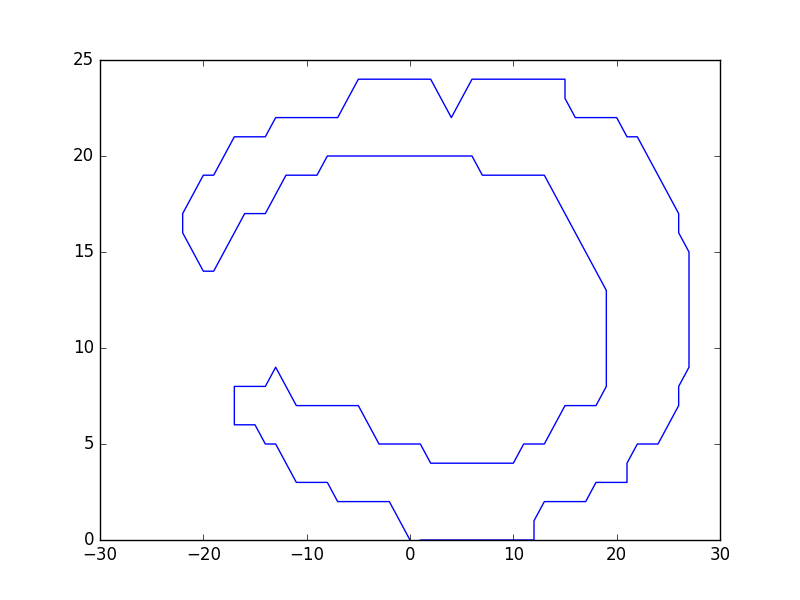
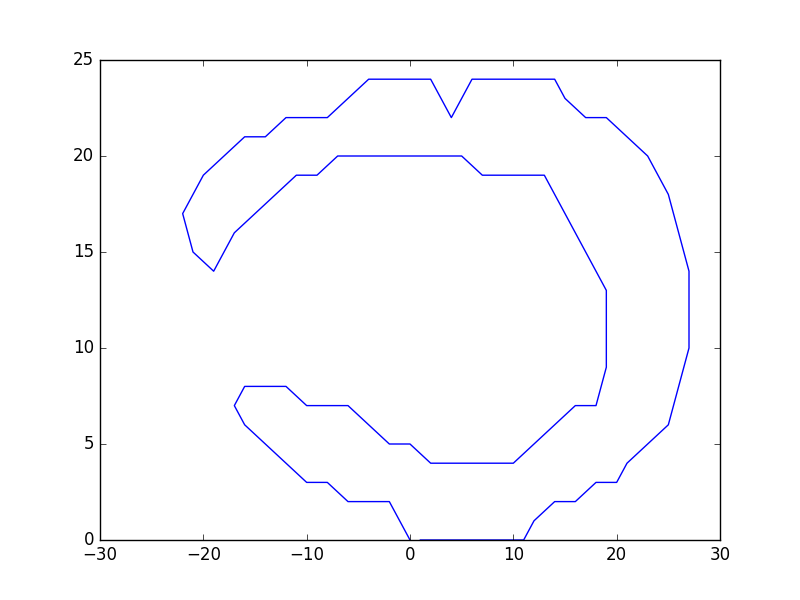
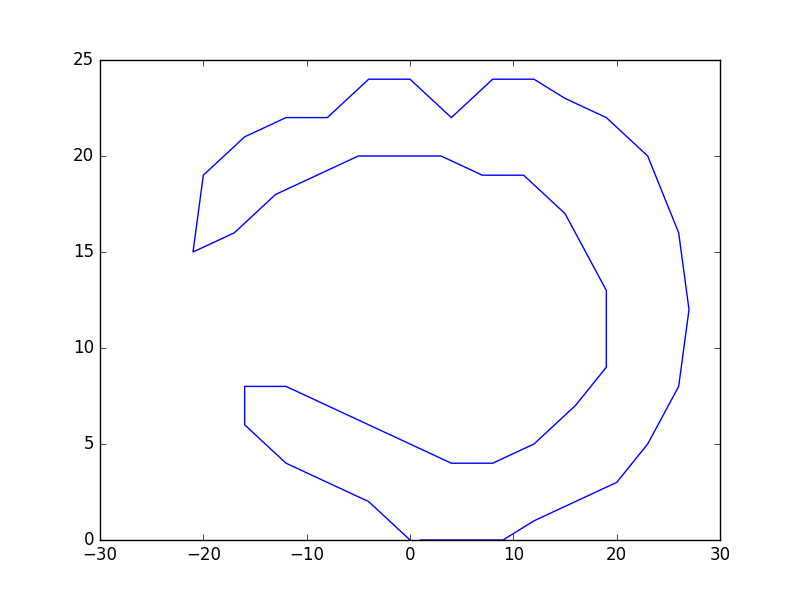
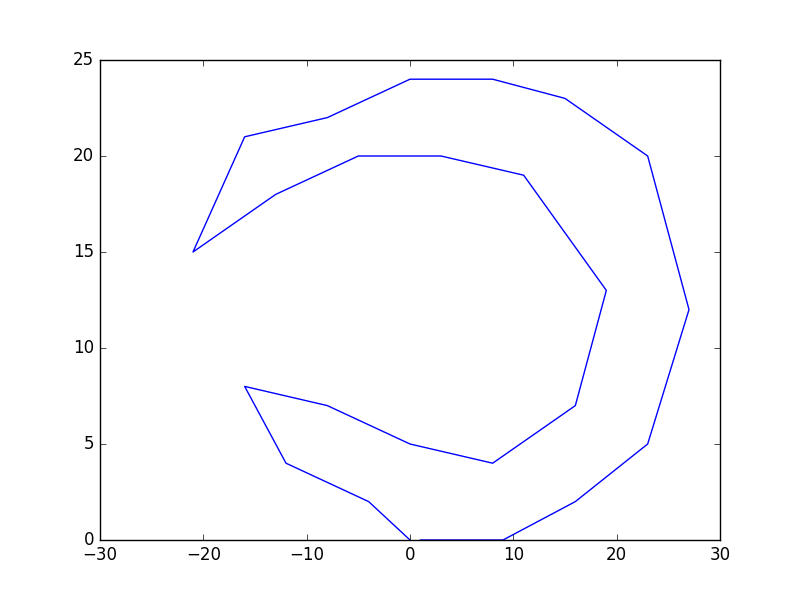
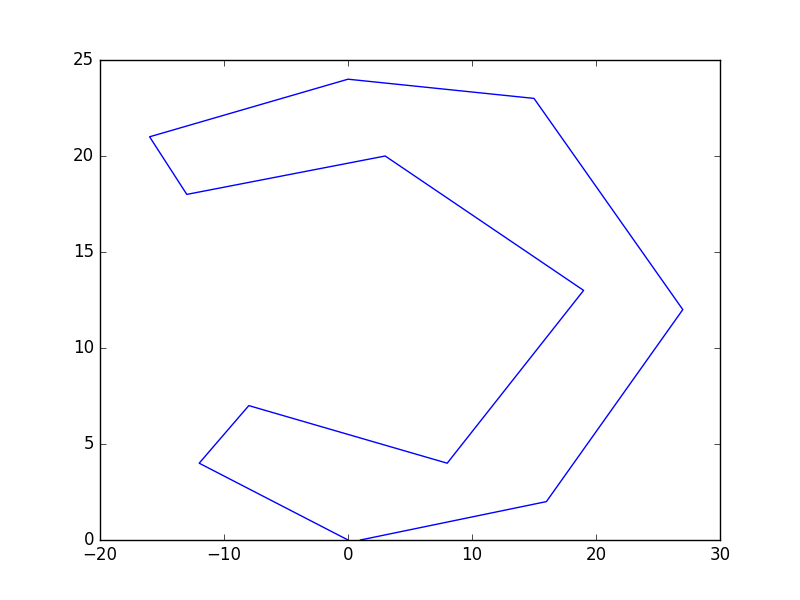
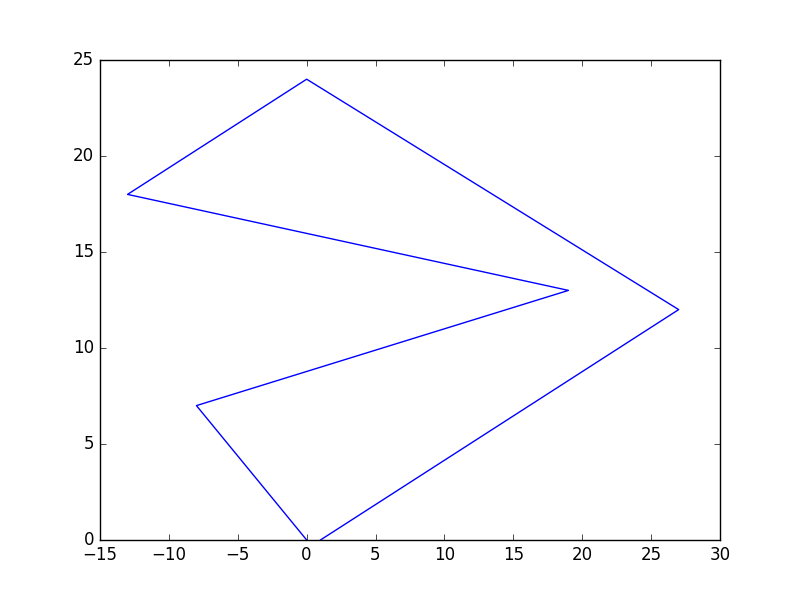
出力(上から順に、オリジナル, 2, 4, 8, 16, 32ステップごとにサンプルをとった場合の集合):
f:id:keimina:20160529120729p:plain
f:id:keimina:20160529120727p:plain
f:id:keimina:20160529120724p:plain
f:id:keimina:20160529120721p:plain
f:id:keimina:20160529120718p:plain
f:id:keimina:20160529120715p:plain